使用Matlab编程

本文介绍了Matlab的基本语法及绘图常用指令。

基本语法

Matlab的变量类型有

  • 数值
  • 向量/矩阵
  • 结构体
  • 元胞数组
  • 字符和字符串
  • 函数句柄

需要查看变量类型时,可以使用class(variable)

数值

Matlab的数值类型包括

  • double(默认)
  • single
  • int8/uint8
  • int16/uint16
  • int32/uint32
  • int64/uint64

Matlab支持复数运算,可以使用1+2i或者1+2j的形式表示。当运算结果为无穷时,表示为Inf,例如2/0;当运算结果不存在时,表示为NaN,例如 Inf-Inf。常见的运算有

1
2
3
floor(pi)	% 向上取整
ceil(pi) % 向下取整
round(pi) % 向最近整数取整,同int8(pi)

向量/矩阵

1
2
3
4
5
6
7
8
9
10
11
12
13
14
15
16
17
18
19
20
21
22
23
24
25
26
27
28
29
30
31
32
33
34
35
36
37
38
39
40
41
42
43
44
45
46
47
48
49
50
51
52
53
54
55
56
57
58
59
60
61
size(A)				% 获取矩阵形状
numel(A) % 获取元素数目

eye(5) % 创建单位矩阵
diag([1,2,3]) % 创建对角矩阵
zeros(2, 3) % 创建零矩阵
rand(2, 3) % 创建(0,1)均匀分布随机数矩阵

linspace(x1, x2, n) % 创建包括x1、x2之间n各等间距点的行向量
logspace(x1, x2, n) % 创建包括10^a、10^b之间n各等间距点的行向量

A(2) % 根据线性索引访问元素,线性索引按列排列
A(2, 3) % 访问矩阵的一个元素
A(2, [1, 3]) % 访问矩阵的多个元素
A(1:3, 2:4) % 访问一个子矩阵
A(1:3, 2:end) % 访问一个子矩阵,end指代末尾
A(:, 3) % 访问一个子矩阵,:指代左右行或者所有列
A(:, 3) = [] % 删除矩阵的一列

% 创建多维数组,前两个维度为一个矩阵,后面的维度成为页,等同于zeros(3, 3, 2)
A(3, 3, 2) = 0
% 访问多维数组的一页,获得一个矩阵
A(:, :, 1)
% 访问多维数组所有页的某一列,获得多个页的一列
A(:, 1, :)
% 为了获得完整的矩阵,可以采用permute函数
% 将原来的第1、2、3维度移动为第1、3、2维度
P = permute(A, [1, 3, 2])
P(:, :, 1)

reshape(eye(6), 18, 2) % 改变矩阵形状,按列进行修改,元素数目必须相同

find(A) % 获得非0元素的索引值

sort(A) % 对向量按升序排序,对矩阵按列排序
sort(A, dim) % 对矩阵按指定维度排序
sortrows(A) % 基于第一列中的元素按升序对矩阵行进行排序,影响整个行

repelem([1,2,3], 2) % 重复元素, 为[1,1,2,2,3,3]
repelem([1;2;3], 2) % 重复元素, 为[1;1;2;2;3;3]
repelem([1,2;3,4],3,2)
% 重复元素,为
% [ 1 1 2 2
% 1 1 2 2
% 1 1 2 2
% 3 3 4 4
% 3 3 4 4
% 3 3 4 4 ]

repmat(diag([1, 2]), 2)
% 重复矩阵,为
% [ 1 0 1 0
% 0 2 0 2
% 1 0 1 0
% 0 2 0 2 ]
repmat(diag([1, 2]), 2, 3)
% 重复矩阵,为
% [ 1 0 1 0 1 0
% 0 2 0 2 0 2
% 1 0 1 0 1 0
% 0 2 0 2 0 2 ]

结构体

结构体数组是使用名为字段的数据容器将相关数据组合在一起的数据类型。每个字段都可以包含任意类型的数据。

1
2
3
patient.name = 'John Doe';
patient.billing = 127.00;
patient.test = [79, 75, 73; 180, 178, 177.5; 220, 210, 205];

元胞数组

元胞数组是一种包含名为元胞的索引数据容器的数据类型,其中的每个元胞都可以包含任意类型的数据

1
2
C = cell(2,2)	% 创建元胞数组
C = {1, 'hello'}

字符和字符串

Matlab的字符串可以用单引号或者双引号表示,常用函数有

1
2
3
4
5
6
7
8
9
10
11
12
str = 'Hello World!'	% 创建一个字符串数组
str(1) % 访问/修改一个字符
['hello', 'world'] % 字符串的连接
sprintf('%0.5e', 1/eps) % 格式化输出, '4.50360e+15'
sprintf('%0.5f', 1/eps) % 格式化输出, '4503599627370496.00000'
sprintf('%0.5g', 1/eps) % 格式化输出, '4.5036e+15'
sprintf('%d', 2) % 格式化输出, '2'
sprintf('%s', 'hello') % 格式化输出, 'hello'
replace('hello', 'e', 'a') % 替换
lower('ABC') % 转换为小写
upper('abc') % 转换为大写
strip(' hello ') % 删除前后空格

正则表达式

1
2
3
4
5
6
str = 'The regexp function helps you relax.';
expression = '\w*x\w*';
matchStr = regexp(str,expression,'match')
% Output:
% matchStr = 1x2 cell array
% {'regexp'} {'relax'}

函数句柄

1
2
3
% 创建函数句柄
f = @myfunction; % 添加@符号创建句柄指向现有函数
sqr = @(n) n.^2; % 通过匿名函数创建句柄

常用操作

CMD输入和输出

1
2
3
disp('Hello World!')	% 输出字符串
num = input('Input a number:') % 获取输入表达式
str = input('Input a string:', 's') % 获取输入字符串

输入输出

1
2
3
4
5
6
7
8
% 导入数据,DELIM是分隔符,NHEADERLINES是头部行数
% 输出为一个结构,包括
% - 矩阵 data
importdata(FILENAME, DELIM, NHEADERLINES)

% 导入xls数据,SHEET是文件薄名称
% 数值放在NUM,文本放在TXT,其他放在RAW
[NUM,TXT,RAW]=xlsread(FILE,SHEET)

绘图

Matlab的Figure的子对象包括

  • Annotation
  • Axes
  • Illustration

Matlab中的Axes对象同时包括x轴、y轴标注、标记、曲线等,其子对象有

  • Line

保存图片

1
2
3
4
5
6
7
8
9
% 保存图片
% 支持的格式有bmp, png, jpg; emf, pdf, eps, svg
saveas(gcf,'example.png')

% 以特定尺寸输出
fig = gcf;
fig.PaperUnits = 'inches';
fig.PaperPosition = [0 0 6 3];
saveas(gcf,'example.png')

线性图表

基本绘制

1
2
3
4
5
6
7
8
9
10
11
12
% 绘制2D图表
% X是横坐标,Y是纵坐标
% h是返回的一组Line对象的向量
h = plot(X, Y)
% 在指定Axes上绘制
h = plot(ax, X, Y)
% x轴和y轴均为对数
h = loglog(X, Y)
% x轴为对数
h = semilogx(X, Y)
% y轴为对数
h = semilogy(X, Y)

双Y轴绘制

1
2
3
4
5
6
7
% 绘制双Y轴2D图表
x = linspace(0,10);
yyaxis left
plot(x,sin(x))

yyaxis right
plot(x, sin(2*x))

标注及范围设置

1
2
3
4
5
6
7
8
9
10
11
12
13
14
15
16
17
18
19
20
21
22
% 设置坐标轴和标题名称
title('')
xlabel('')
ylabel('')

% 设置范围
axis([xmin, xmax, ymin, ymax])
xlim([xmin, xmax])
ylim([ymin, ymax])

% 设置Tick位置
xticks([-2*pi -pi 0 pi 2*pi])
% 设置Tick标注
xticklabels({'-2\pi','-\pi','0','\pi','2\pi'})

% 设置图例
lgd = legend(label1, label2, 'Location', 'southeast')
% 设置部分图例,其中h1和h3是需要添加图例的Line Object
legend([h1 h3], {'First','Third'})

box on;
grid on;

属性设置

1
2
3
4
5
6
7
8
9
10
11
12
13
14
15
16
17
18
19
20
21
22
23
24
25
26
27
28
29
30
31
32
33
% 设置线条类型
% 可选属性有'none', '-', '--', ':', '-.'
set(h, 'LineStyle', '-')
h.LineStyle = '-'
% 设置线宽
set(h, 'LineWidth', 0.5)
% 设置线颜色
set(h, 'Color', [0.5, 0.5, 0.5])

% 设置Marker类型
% 可选属性有'none', '+', 'o', '*', '.', 'x', 'square', 'diamond', 'v', '^', '<', '>', 'pentagram', 'hexagram'
set(h, 'Marker', 'x')
% 设置Marker大小
set(h, 'MarkerSize', 6)
% 设置Marker位置(每5个点)
set(h, 'MarkerIndices', 1:5:length(Y))
% Marker的颜色属性有'MarkerEdgeColor', 'MarkerFaceColor'

% 设置字体
% 常见字体有
% - SimHei(黑体)
% - SimSun(宋体)
% - KaiTi(楷体)
% - FangSong(仿宋)
% - Times New Roman
% - Arial
% - Arial Narrow
% - Courier New
set(h, 'FontSize', 'Arial')
% 设置字重,可选'normal', 'bold'
set(h, 'FontWeight', 'bold')
% 设置字号
set(h, 'FontSize', 16)

综合示例

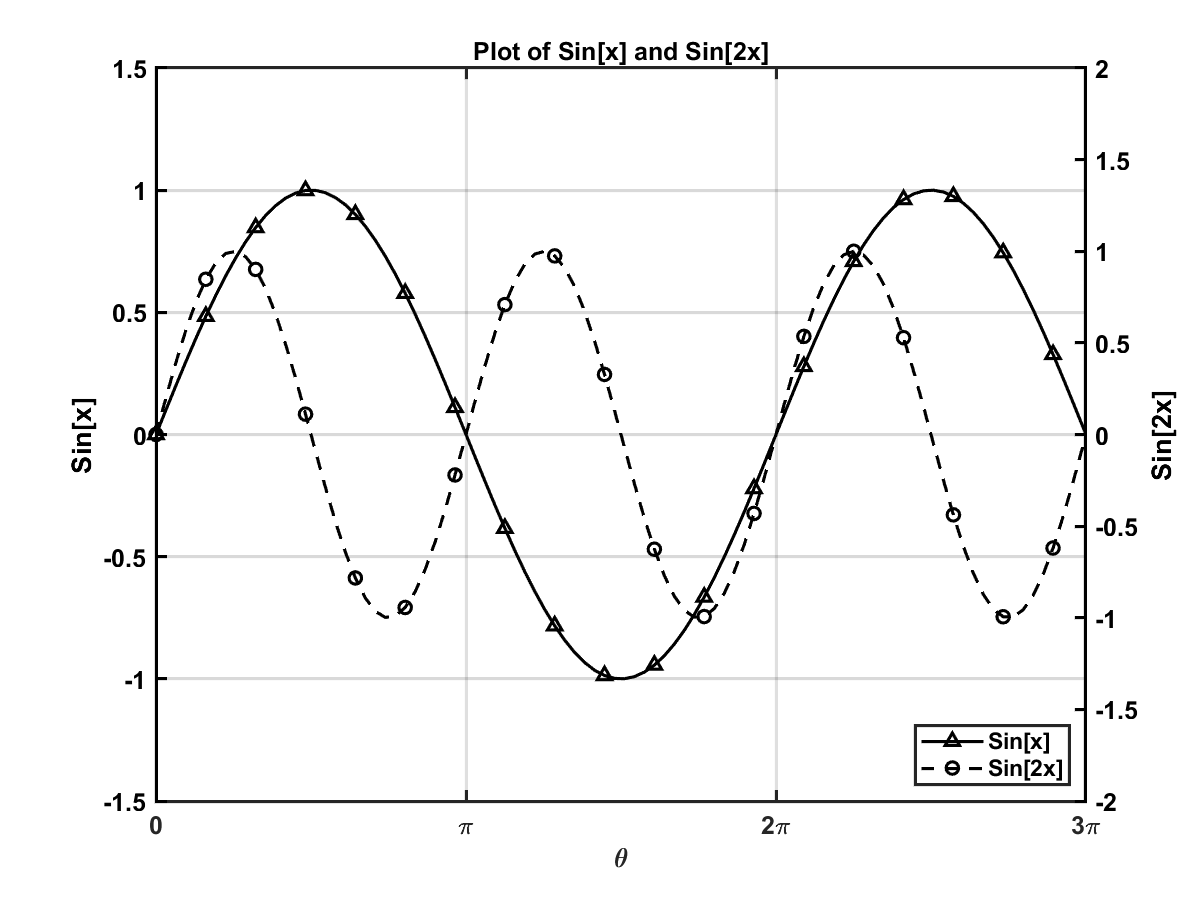
2D plot

1
2
3
4
5
6
7
8
9
10
11
12
13
14
15
16
17
18
19
20
21
22
23
24
25
26
27
28
29
30
31
32
33
34
35
36
37
38
39
40
41
42
43
44
45
46
f = figure(1);          % obtain a handle to the Figure
a = subplot(1, 1, 1); % obtain a handle to the Axes

a.LineWidth = 1.5;
a.FontName = 'Arial';
a.FontWeight = 'bold';
a.FontSize = 12;

x = linspace(0, 10);

colororder({'k', 'k'}) % set the color of the left and the right axes

yyaxis(a, 'left'); % switch to the left part of the Axes
hl = plot(x, sin(x)); % obtain a handle to the Line
hl.LineWidth = 1.5;
hl.Marker = "^";
hl.MarkerIndices = 1:5:length(x);
ylabel(a, 'Sin[x]')
ylim(a, [-1.5, 1.5])

yyaxis(a, 'right') % switch to the right part of the Axes
hr = plot(x, sin(2*x));
hr.LineStyle = '--';
hr.LineWidth = 1.5;
hr.Marker = 'o';
hr.MarkerIndices = 1:5:length(x);
ylabel(a, 'Sin[2x]')
ylim(a, [-2, 2])

xlabel(a, '\theta')
xlim(a, [0 3*pi])
xticks(a, [0, pi, 2*pi, 3*pi])
xticklabels(a, {'0', '\pi', '2\pi', '3\pi'})

box on;
grid on;

lgd = legend([hl, hr], {'Sin[x]', 'Sin[2x]'}, 'Location', "southeast");
tl = title(a, 'Plot of Sin[x] and Sin[2x]');
tl.FontName = 'Arial';
tl.FontWeight = 'bold';
tl.FontSize = 12;

f.PaperUnits = 'inches';
f.PaperPosition = [0 0 8 6];
saveas(f,'example.png') % export the figure

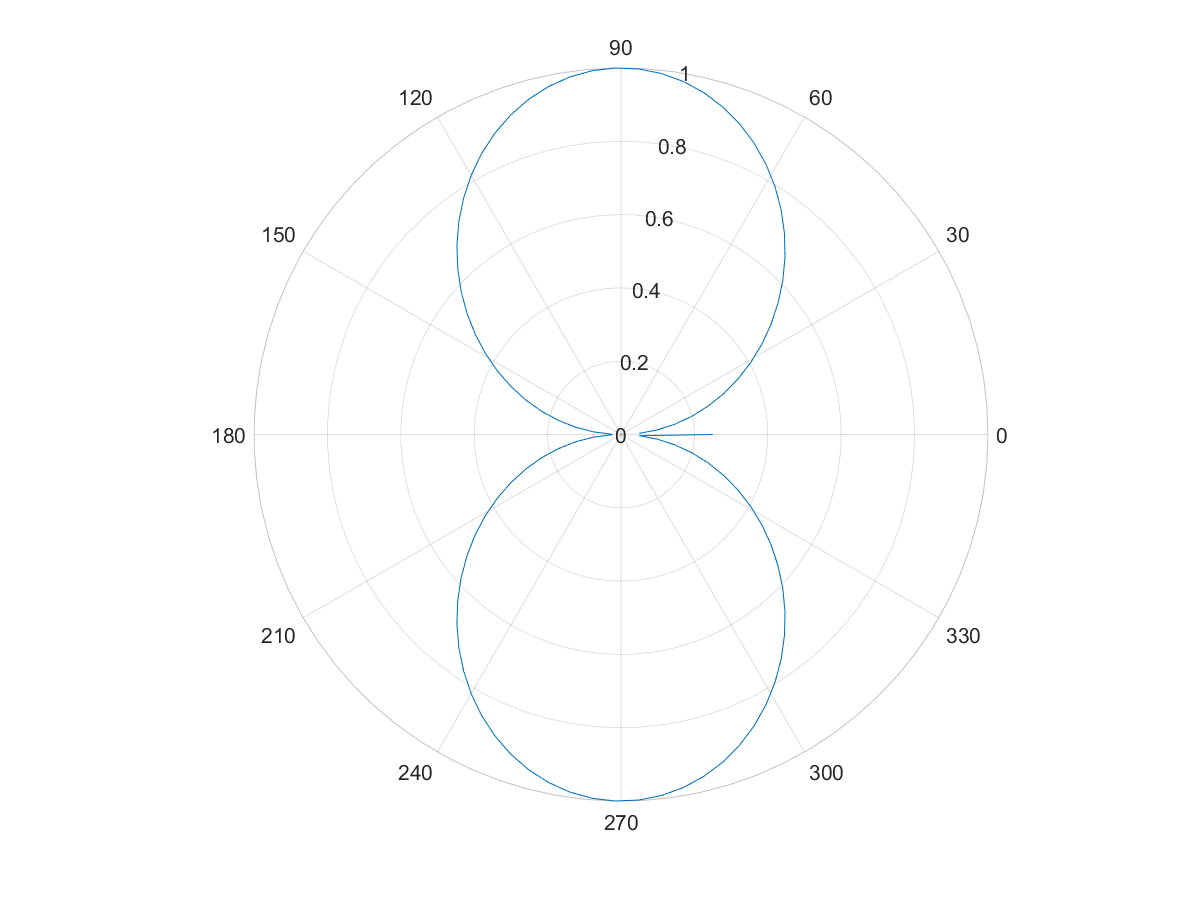
极坐标绘图

Polar plot

1
2
3
x = linspace(0, 2*pi);
En = abs(cos(pi/2*cos(x))./sin(x));
h = polarplot(x, En);

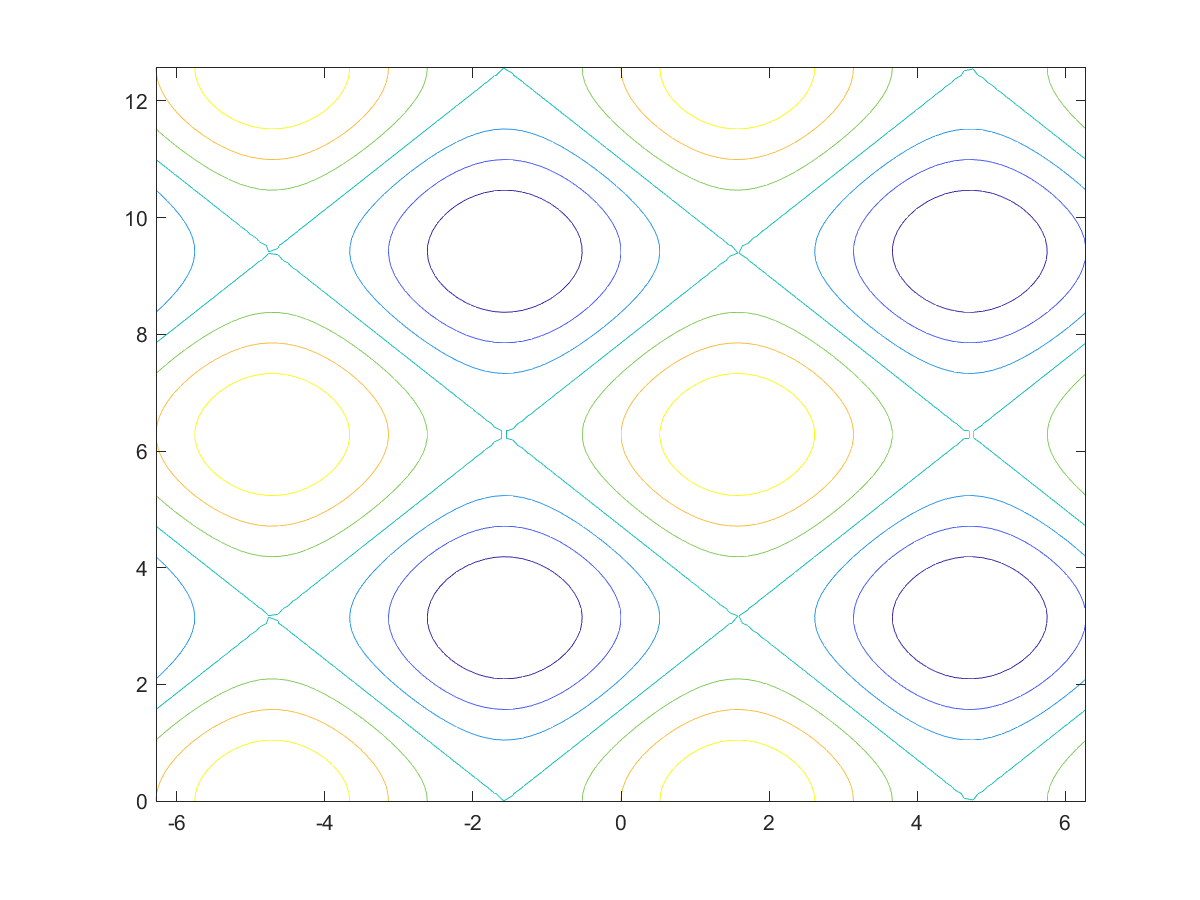
等高线图

Contour plot

1
2
3
4
5
6
7
8
x = linspace(-2*pi,2*pi);
y = linspace(0,4*pi);
[X,Y] = meshgrid(x,y);
Z = sin(X)+cos(Y);
contour(X, Y, Z) % X, Y为完整矩阵,或者
contour(x, y, Z) % x, y为向量,相同结果
contour(X, Y, Z, [-1.2, -0.6, 0, 0.6, 1.2]) % 指定幅度等高线
contour(X, Y, Z, 'ShowText', 'on') % 带有标注

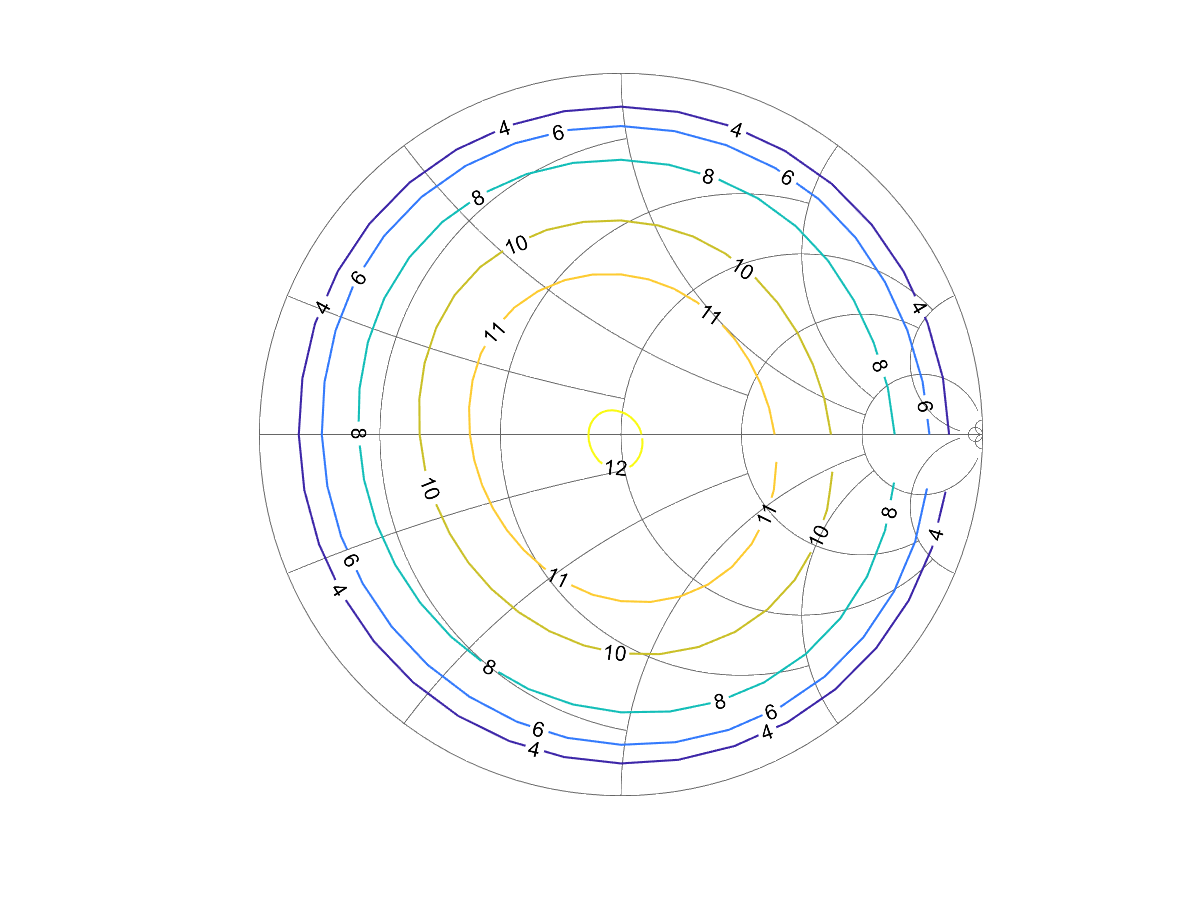
史密斯圆等高线图

Smith contour plot

1
2
3
4
5
6
7
8
9
10
data = importdata(fileName, ',', 5);
data = data.data;
data = data(:, 2:end);
[r, theta] = meshgrid(0:0.05:0.95, (0:10:350)/180*pi);
h = smithchart();
h.LabelVisible = 'off';
h.SubColor = [0.2 0.2 0.2];
delete(h)
hold on
contour(r.*cos(theta), r.*sin(theta), data, [4,6,8,10,11,12,13], 'ShowText','on', 'LineWidth', 1)

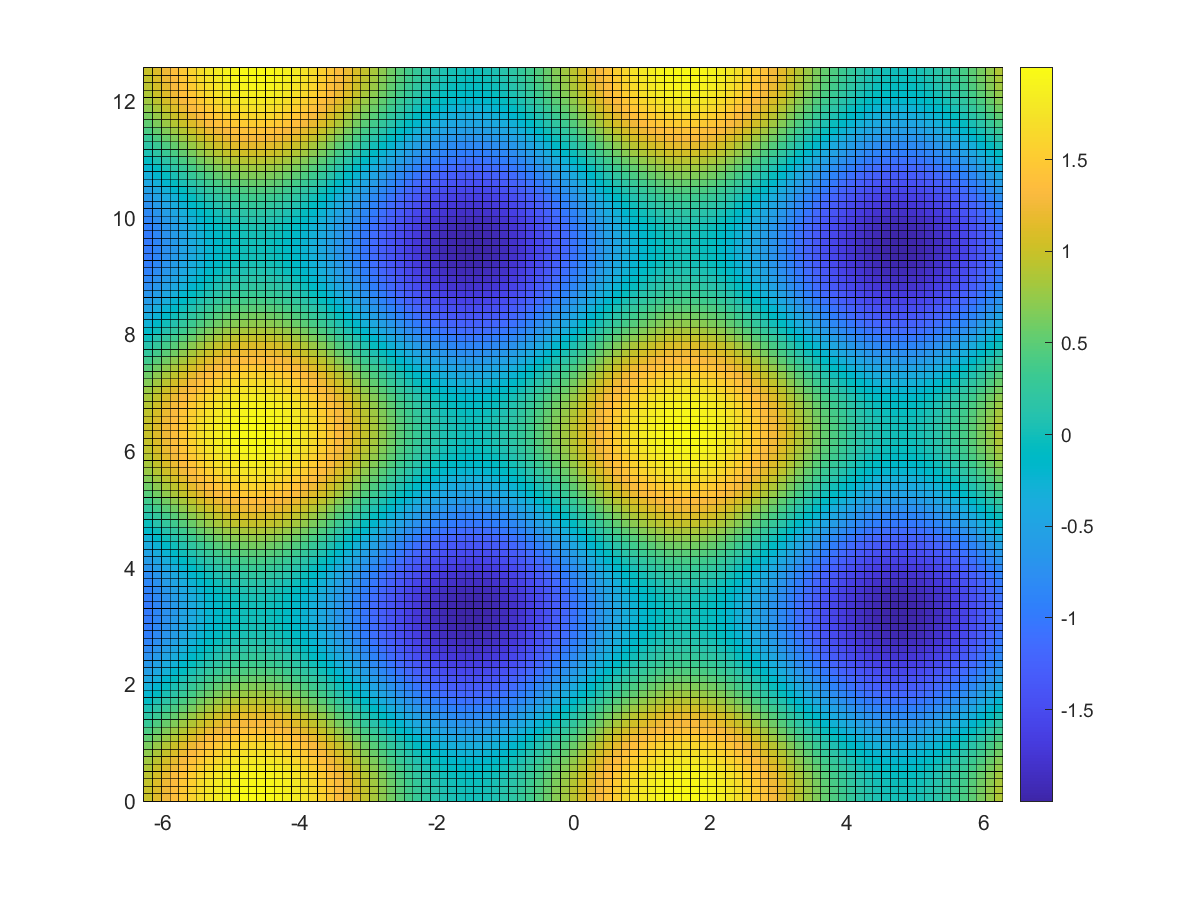
伪彩色图

Pseudo color plot

1
2
3
4
5
6
7
8
9
10
x = linspace(-2*pi,2*pi);
y = linspace(0,4*pi);
[X,Y] = meshgrid(x,y);
Z = sin(X)+cos(Y);
s = pcolor(x, y, Z);
colorbar; % 显示颜色图例
caxis([-5, 5]) % 颜色范围
colormap(gca, spring); % 更换颜色图
s.LineStyle = 'none'; % 无线条
s.FaceColor = 'interp'; % 对颜色插值

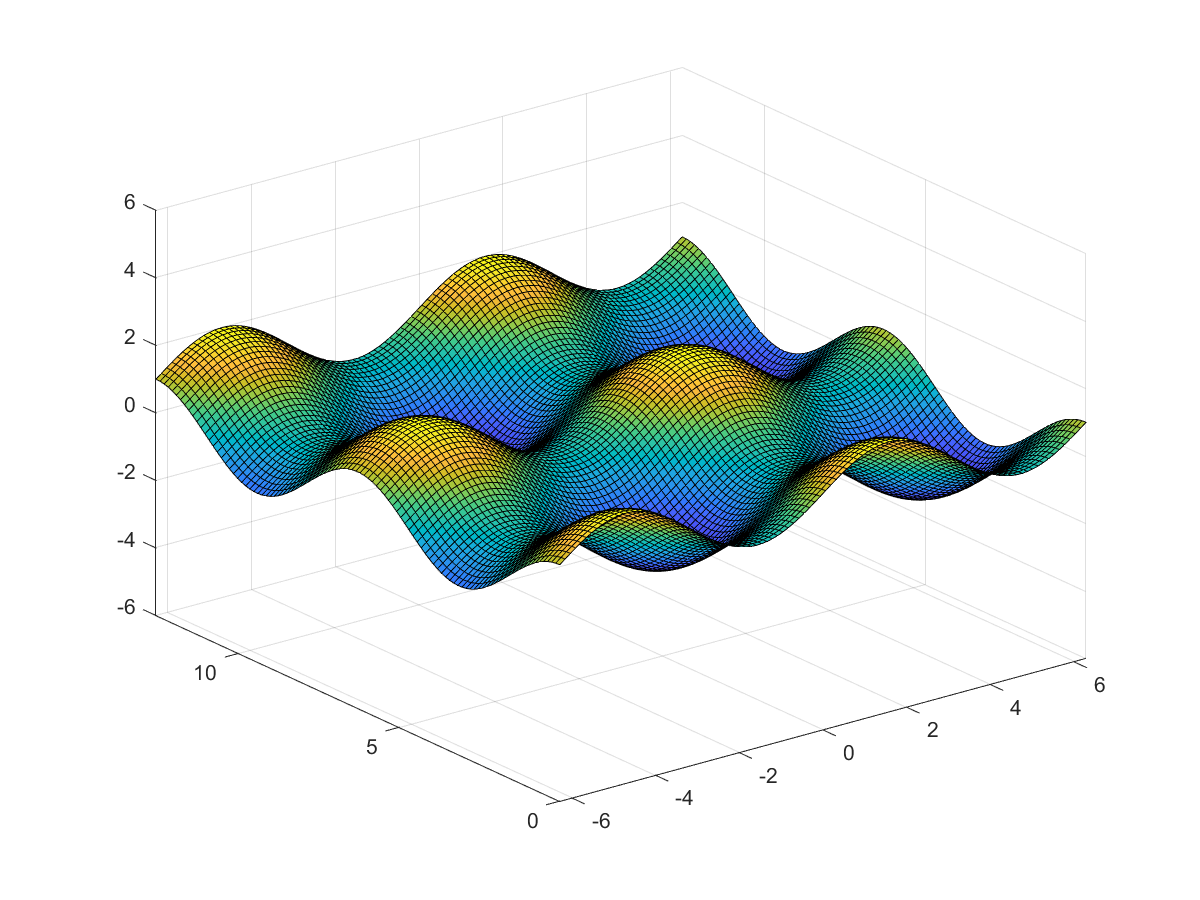
曲面图

Surf plot

1
2
3
4
5
6
x = linspace(-2*pi,2*pi);
y = linspace(0,4*pi);
[X,Y] = meshgrid(x,y);
Z = sin(X)+cos(Y);
s = surf(x, y, Z);
view(gca, [-37.5, 60]); % 调整视角,默认视角为[-37.5, 30];视角为[0, 90]时退化为伪色彩图

参考

  1. Official Matlab Reference Documentation
0%